Projects

Advertising, Space, and the Measurement of Attention
My dissertation research project examines the relationship between the advertising industry, media technologies, and the attention economy.
Learn More
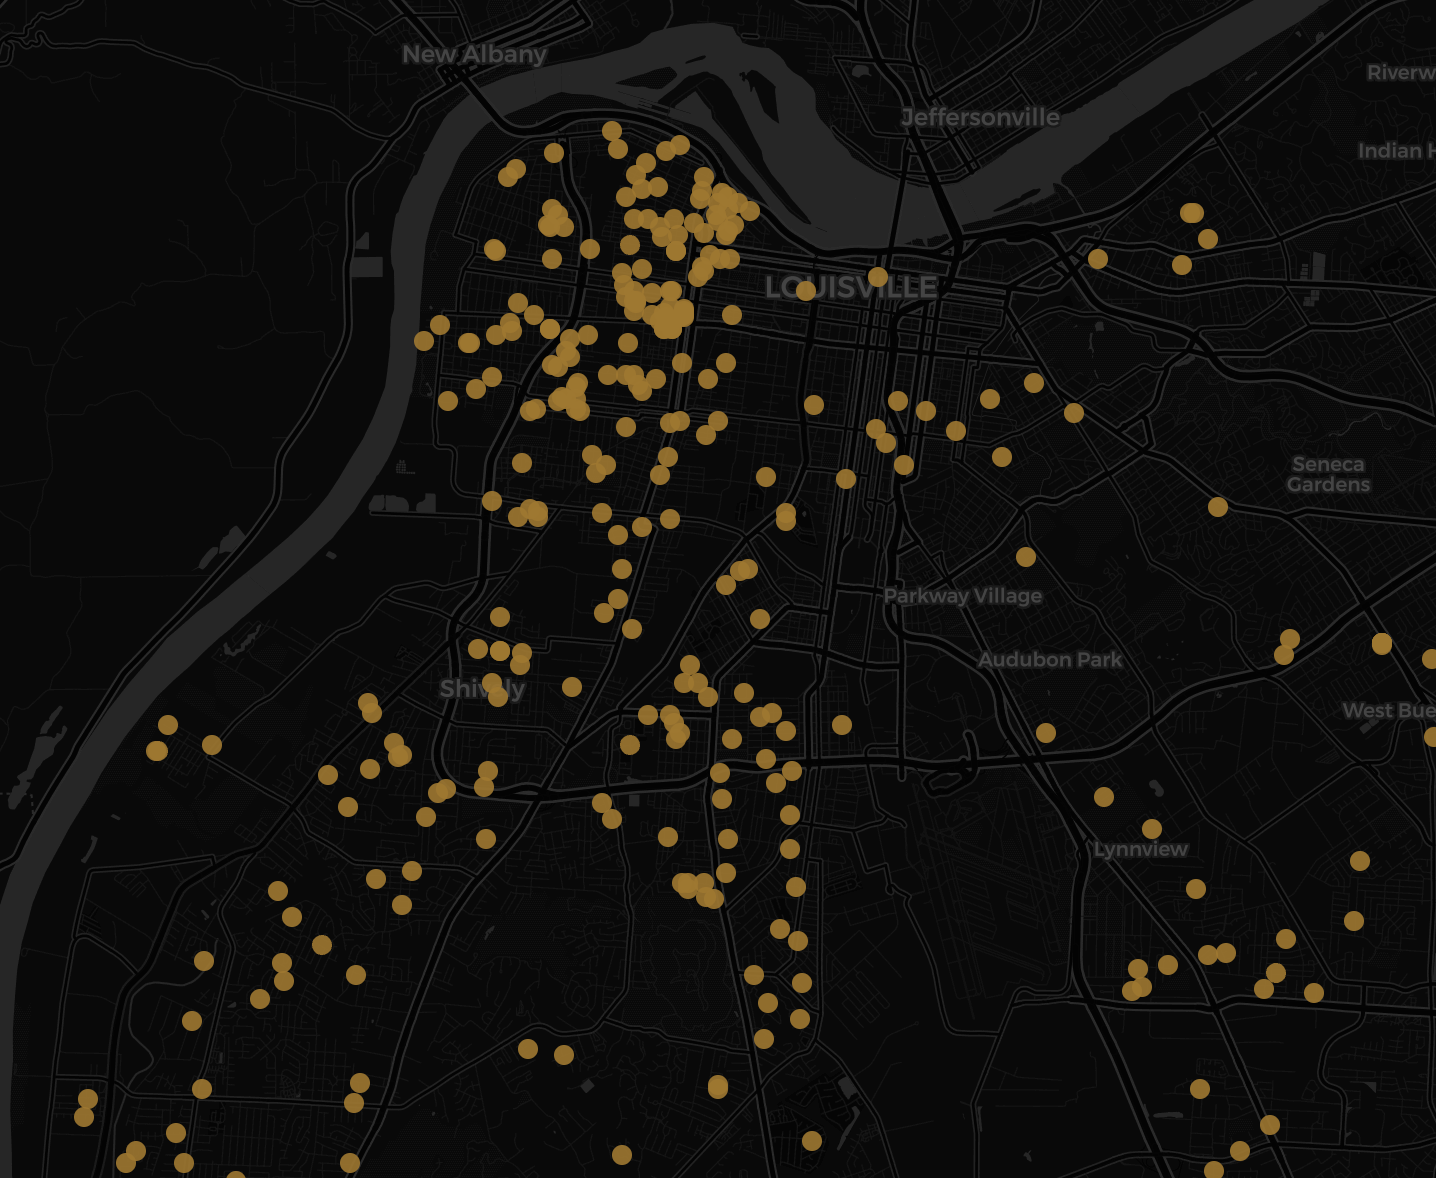
Foreclosure Sales in Louisville, KY (2016-2022)
Maps foreclosures between 2016-2022 in Louisville, searchable by address and aggregated by purchaser. Produced in collaboration with Michael McCanless using data from Jefferson County.
View Map
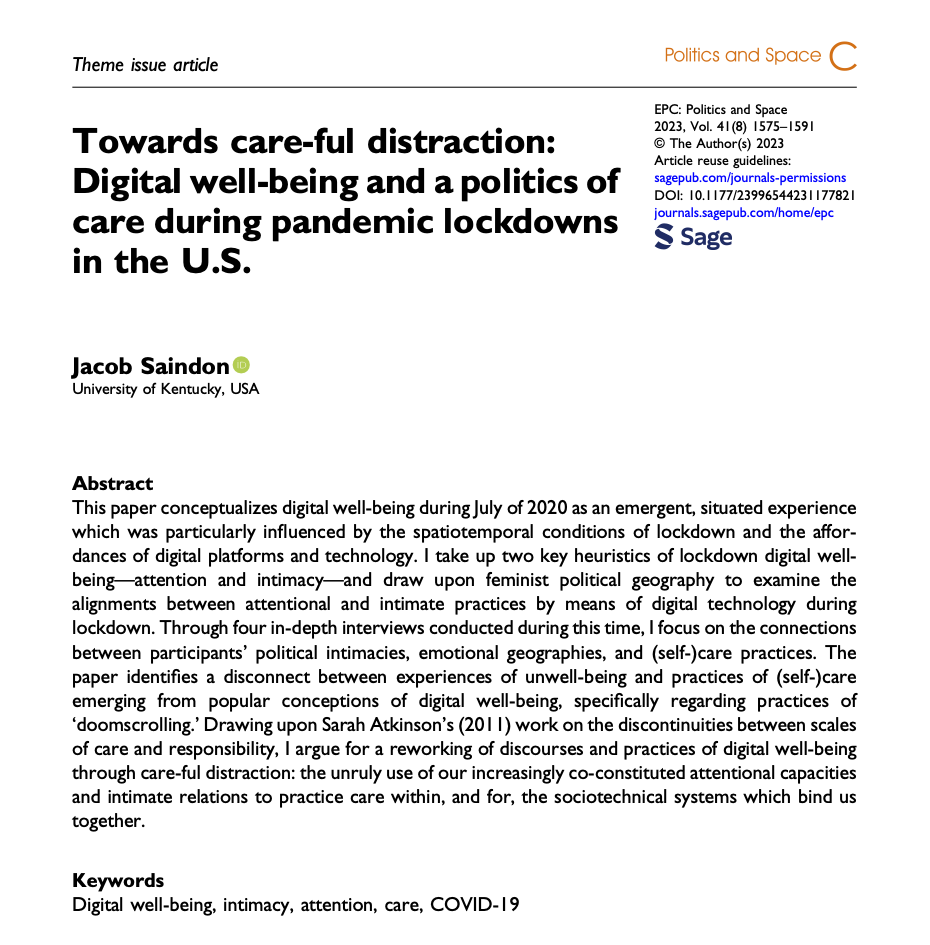
Towards care-ful distraction
This article conceptualizes digital well-being during July of 2020 as an emergent, situated experience which was particularly influenced by the spatiotemporal conditions of lockdown and the affordances of digital platforms and technology.
View Article
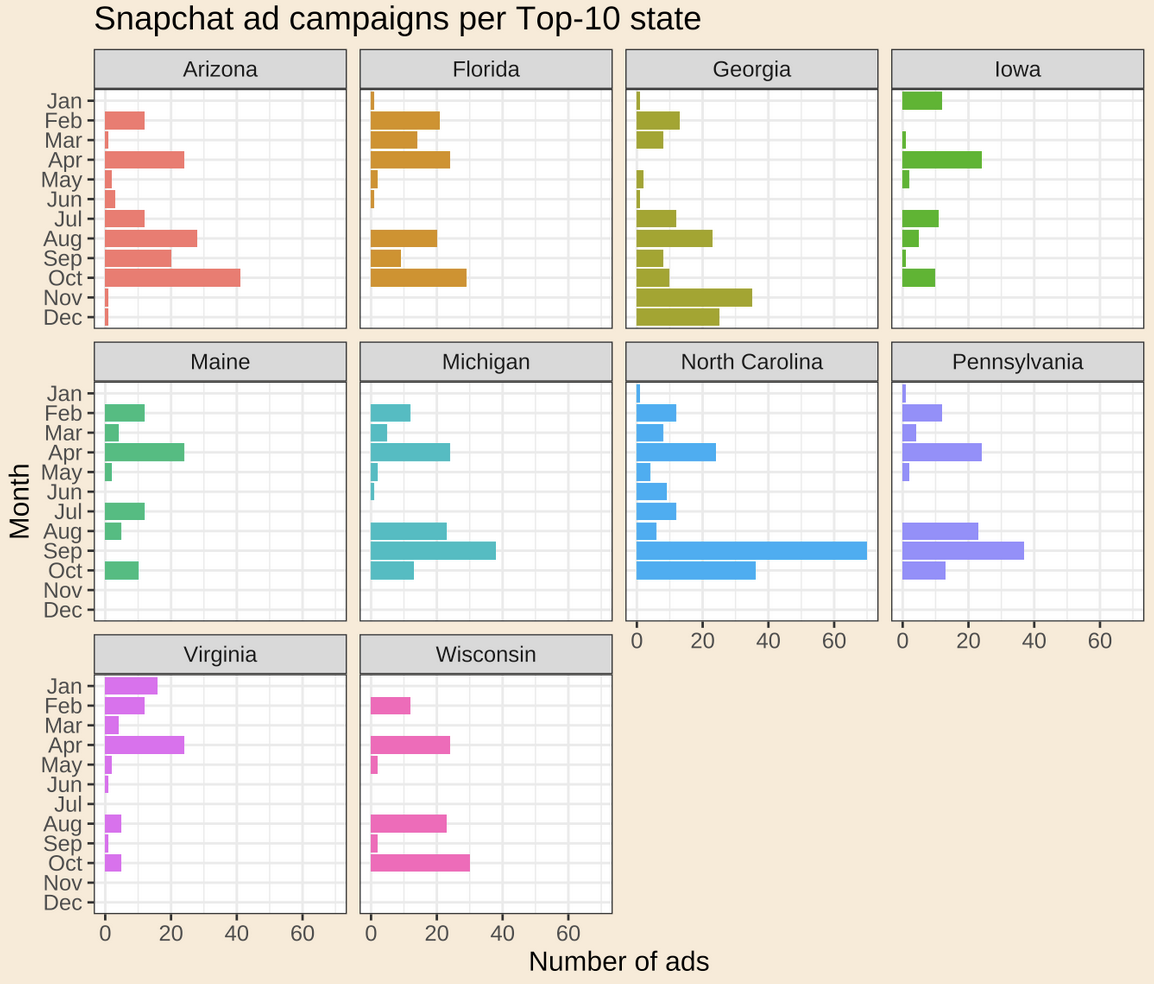
Snap Political Ads Analysis
Analysis of Snap's political ads library from 2020, looking at targeting parameters using ggplot2.
View Data
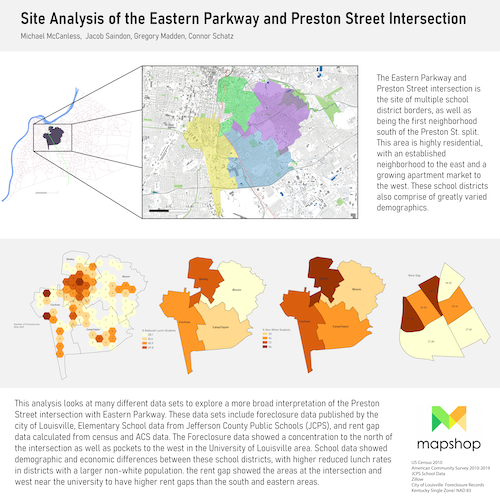
Site Analysis of Preston Ave in Louisville, KY
Maps foreclosures, reduced lunch data, racial demographics, and rent gap data for an site along the Preston Avenue Corridor in Louisville, KY. Produced in collaboration with Michael McCanless, Gregory Madden, and Connor Schatz.
Full Size
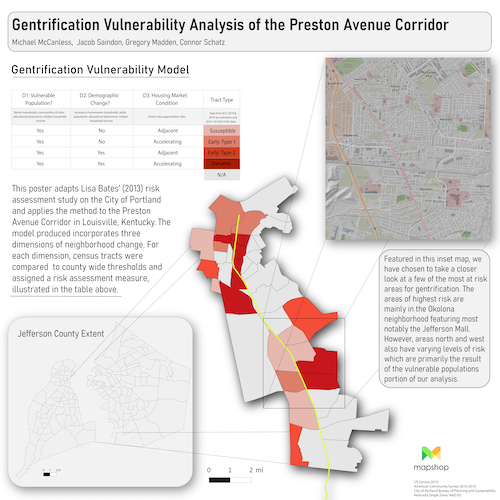
Gentrification Vulnerability in Louisville, KY
Adapts a gentrification vulnerability risk assessment model developed for Portland, OR and applies the method to the Preston Avenue Corridor in Louisville, KY. Produced in collaboration with Michael McCanless, Gregory Madden, and Connor Schatz.
Full Size